Detection of Dextromethorphan Metabolites from Human Liver Microsomes
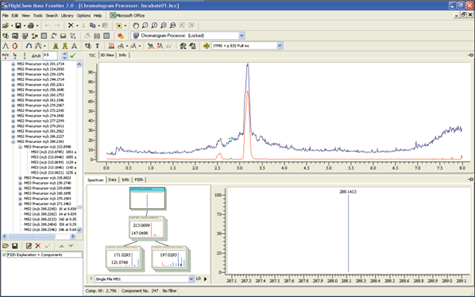
UV-MS 상관관계를 바탕으로 한 대사산물의 정량분석을 위한 첫 단계는, 시험관내 배양으로 관찰된 대사산물을 확인하고 생체내 샘플에서 존재하는 대사산물과 서로 관련시키는 것이다. 생체 내에서 존재하는 대사산물은 MSn을 통한 Fragmentation Pattern을 통해서 구조를 확인한다. 본 연구에서는, 생체 밖에서 고농도로 만든 대사산물은 상대적으로 보다 간단하게 대사체의 양을 측정할 수 있었다. 하지만 혼합된 매트릭스나 저농도의 개사산물은 검출하기가 어렵다. 이러한 데이터 처리는 Mass Frontier소프트웨어로 처리할 수 있다. Mass Frontier의 Fragment Ion Search(FISh)기능은 Parent Drug과 그들의 대사산물간의 공통적으로 발견되는 Fragment Ion을 바탕으로 성분을 검출 할 수 있는 기능이다. 이러한 접근 방법은 Figure1에서 보여준다.
 Figure 1. Fragment ion search (FISh) results on in vitro incubation sample. The raw trace is shown in blue, the FISh extracted trace of metabolites in red, and a minor oxidative metabolite found is highlighted in green.
 Identification of Dextromethorphan Metabolites in Microsomal Incubations
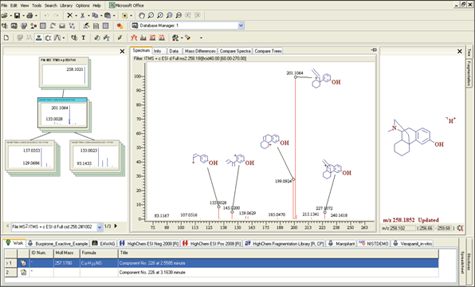
다중 MSn 단계에서 HCD와 CID의 조합은 구조적인 정보를 해석하는데 폭넓은 Fragmentation 데이터를 제공한다. Mass Frontier 소프트웨어는 Figure2에서와 같이 MSn의 Ion Tree를 이용하여 Fragment 해석을 처리하는 소프트웨어이다. 대사산물의 MSn Spectral Tree는 Dextromethorphan의 Spectral Tree와 비교해서 해석한다. 우선적인 Fragment Ion의 FISh해석은 가능성 있는 구조를 예측하는데 사용된다.
 Figure 2. Mass Frontier software annotation of the fragmentation of dextrorphan HCD MSn data
 Establishing a UV-MS Correlation Calibration Curve-Quantifying Metabolites
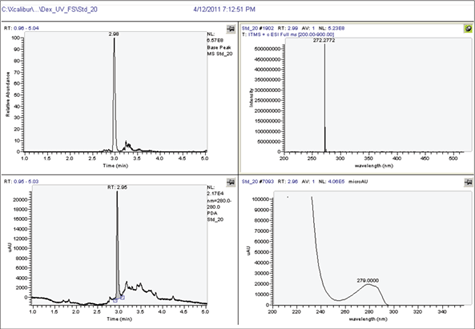
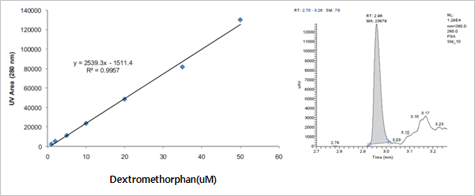
관심있는 대사산물들을 확인한 다음에는, 생체 밖에서 배양된 대사체들의 농도를 확인해야만 한다. 그것은 UV를 기반으로 한 정량분석과 Dextromethorphan의 검량 표준곡선으로 실행 될 수 있다. (Figure 3과 4) 이러한 가설은 대사산물의 몰 흡광 계수와 그 Parent의 몰 흡광 계수가 본질적으로는 동일하다는 데 있다. 질량분석기를 통한 Dextromethorphan 농도에 따른 검량 표준 곡선은 대사체와 그들의 Parent 구조 사이의 이온화 효율이 다를 수 있다는 잠재적인 차이들로 제한적인 면이 있다. 반면 이러한 이유로 UV는 보다 범용적인 검출 방법이기 때문에 본 연구에서 같이 사용하였다.
 Figure 3. 20 μM UV calibration standard of dextromethorphan
  Figure 4. UV calibration curve of dextromethorphan and example peak integration of a 10 μM standard injection
 |